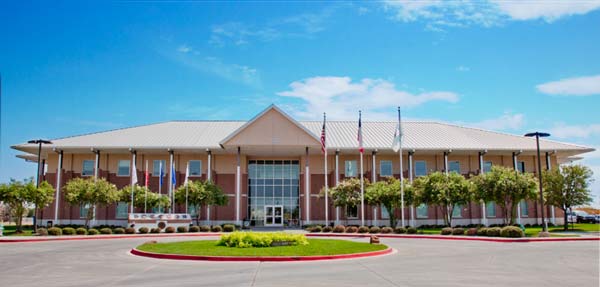
The Retail Trade Demographics for Little Elm have drastically changed in the past twenty years. According to a recent Little Elm Retail Gap Analysis 2013, Little Elm’s retail trade demographic has grown from 30,319 in 2000 to over 137,917 in 2013 which is a 454.89% growth. This tremendous growth has provided increased opportunities that are yet to be realized. The following data is a sample of the 2013 report. As a business considering Little Elm, this Retail Trade Report is sure to provide tremendous insight.
Retail leakage occurs when actual sales within a retail trade area are less than its potential sales.
Retail surplus, on the other hand, occurs when actual sales within a retail trade area are greater than its potential sales.
Retail leakage and surplus figures are used to identify the relative health of a community’s retail market.
Retail Gap Analysis Notes
In some markets, two particular situations may appear to be discrepancies when they occur in a Retail Gap Analysis. First, the amount exhibited for a particular SIC sector’s estimated actual sales may be lower (sometimes significantly so) than expected. In these circumstances, the retailers have often reported sales figures under a different SIC code. For example, some Women’s Clothing Stores (SIC 562) may in fact report sales figures under Family Clothing Stores (SIC 565), etc. The second situation arises when the amount exhibited for a particular SIC sector’s estimated actual sales is reported as $0, even though there are known retailers in a market operating under that SIC code. When there are only two or three retailers in that market reporting under that SIC code, the numbers are often reported as $0 to protect each retailer’s proprietary financial information.
For example, if there were two retailers in a market operating under a specific SIC code, and total estimated actual sales were listed, either retailer could extrapolate its competitor’s estimated actual retail sales figures by deducting its own figures from the total listed for that SIC code.
For more extensive information on each Retail Sector click on the corresponding name.
| SIC | Retail Sector | Potential Sales | Est. Actual Sales | Surplus/Leakage | % Surplus |
| 521 | Lumber and Other Building Materials | $53,520,810 | $40,000,000 | -$13,520,810 | -25% |
| 523 | Paint, Glass and Wallpaper | $16,106,780 | $500,000 | -$15,606,780 | -97% |
| 525 | Hardware Stores | $31,427,500 | $0 | -$31,427,500 | -100% |
| 526 | Retail Nurseries and Garden | $17,601,000 | $400,000 | -$17,201,000 | -98% |
| 527 | Mobile Home Dealers | $5,903,481 | $0 | -$5,903,481 | -100% |
| 53 | General Merchandise Stores | $199,808,700 | $10,000,000 | -$189,808,700 | -95% |
| 541 | Grocery Stores | $228,580,600 | $50,000,000 | -$178,580,600 | -78% |
| 542 | Meat and Fish Markets | $7,266,367 | $2,100,000 | -$5,166,367 | -71% |
| 543 | Fruit and Vegetable Markets | $4,447,246 | $0 | -$4,447,246 | -100% |
| 544 | Candy, Nut and Confection Stores | $755,156 | $0 | -$755,156 | -100% |
| 545 | Dairy Products Stores | $384,982 | $0 | -$384,982 | -100% |
| 546 | Retail Bakeries | $2,735,430 | $0 | -$2,735,430 | -100% |
| 549 | Miscellaneous Food Stores | $15,593,690 | $400,000 | -$15,193,690 | -97% |
| 551 | New and Used Car Dealers | $279,842,400 | $0 | -$279,842,400 | -100% |
| 552 | Used Car Dealers | $50,860,060 | $0 | -$50,860,060 | -100% |
| 553 | Auto and Home Supply Stores | $67,008,040 | $3,600,000 | -$63,408,040 | -95% |
| 554 | Gasoline Service Stations | $61,425,170 | $22,000,000 | -$39,425,170 | -64% |
| 555 | Boat Dealers | $5,757,342 | $0 | -$5,757,342 | -100% |
| 556 | Recreational Vehicle Dealers | $9,175,180 | $0 | -$9,175,180 | -100% |
| 557 | Motorcycle Dealers | $8,102,640 | $600,000 | -$7,502,640 | -93% |
| 559 | Automotive Dealers, NEC | $13,278,000 | $800,000 | -$12,478,000 | -94% |
| 561 | Men’s and Boys’ Clothing Stores | $4,540,594 | $0 | -$4,540,594 | -100% |
| 562 | Women’s Clothing Stores | $8,726,464 | $0 | -$8,726,464 | -100% |
| 563 | Women’s Accessory and Specialty Stores | $1,271,469 | $0 | -$1,271,469 | -100% |
| 564 | Children’s and Infants’ Wear | $2,252,593 | $0 | -$2,252,593 | -100% |
| 565 | Family Clothing Stores | $9,983,770 | $100,000 | -$9,883,770 | -99% |
| 566 | Shoe Stores | $11,528,850 | $1,000,000 | -$10,528,850 | -91% |
| 569 | Miscellaneous Apparel and Accessory Stores | $5,661,419 | $0 | -$5,661,419 | -100% |
| 571 | Home Furniture and Furnishing | $49,795,890 | $900,000 | -$48,895,890 | -98% |
| 572 | Household Appliance Stores | $10,702,880 | $0 | -$10,702,880 | -100% |
| 573 | Radio, TV, and Computer Stores | $117,559,100 | $25,000,000 | -$92,559,090 | -79% |
| 5812 | Eating Places | $259,580,600 | $23,000,000 | -$236,580,600 | -91% |
| 5813 | Drinking Places | $7,793,624 | $400,000 | -$7,393,624 | -95% |
| 591 | Drug Stores and Proprietary | $49,927,860 | $7,000,000 | -$42,927,860 | -86% |
| 592 | Liquor Stores | $4,975,147 | $1,400,000 | -$3,575,147 | -72% |
| 593 | Used Merchandise Stores | $10,286,350 | $0 | -$10,286,350 | -100% |
| 5941 | Sporting Goods, Bicycle and Gun Stores | $8,718,095 | $750,000 | -$7,968,095 | -91% |
| 5942 | Book Stores | $3,739,086 | $100,000 | -$3,639,086 | -97% |
| 5943 | Stationery Stores | $12,954,180 | $0 | -$12,954,180 | -100% |
| 5944 | Jewelry Stores | $6,056,057 | $200,000 | -$5,856,057 | -97% |
| 5945 | Hobby, Toy and Game Shops | $6,787,393 | $1,100,000 | -$5,687,393 | -84% |
| 5946 | Camera and Photography Supply Stores | $487,987 | $0 | -$487,987 | -100% |
| 5947 | Gift, Novelty and Souvenir Shops | $7,852,852 | $100,000 | -$7,752,852 | -99% |
| 5948 | Luggage and Leather Goods Stores | $307,728 | $0 | -$307,728 | -100% |
| 5949 | Sewing, Needlework and Craft Stores | $927,046 | $0 | -$927,046 | -100% |
| 596 | Non-store Retailers | $19,336,630 | $200,000 | -$19,136,630 | -99% |
| 598 | Fuel and Ice Dealers | $1,621,687 | $400,000 | -$1,221,687 | -75% |
| 5992 | Florists | $3,986,942 | $100,000 | -$3,886,942 | -97% |
| 5993 | Tobacco Stores and Stands | $856,874 | $0 | -$856,874 | -100% |
| 5994 | News Dealers and Newsstands | $587,773 | $0 | -$587,773 | -100% |
| 5995 | Optical Goods Stores | $4,785,231 | $0 | -$4,785,231 | -100% |
| 5999 | Miscellaneous Retail Stores, NEC | $70,337,040 | $3,300,000 | -$67,037,040 | -95% |
| TOTALS | $1,783,509,000 | $195,450,000 | -$1,588,060,000 | leakage |


